

| Profiling Code Coverage | ||
|---|---|---|
|
|
|
|
| Opening gcov result | Gcov main view | |
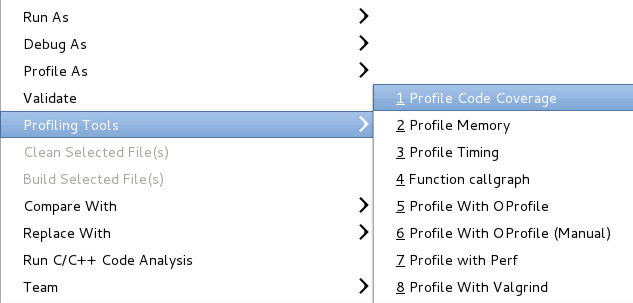
Another way to use the gcov plug-in is to profile your executable using Profiling Tools->Profile Code Coverage. This assumes that the executable has been set up to build with the proper compilation flags.
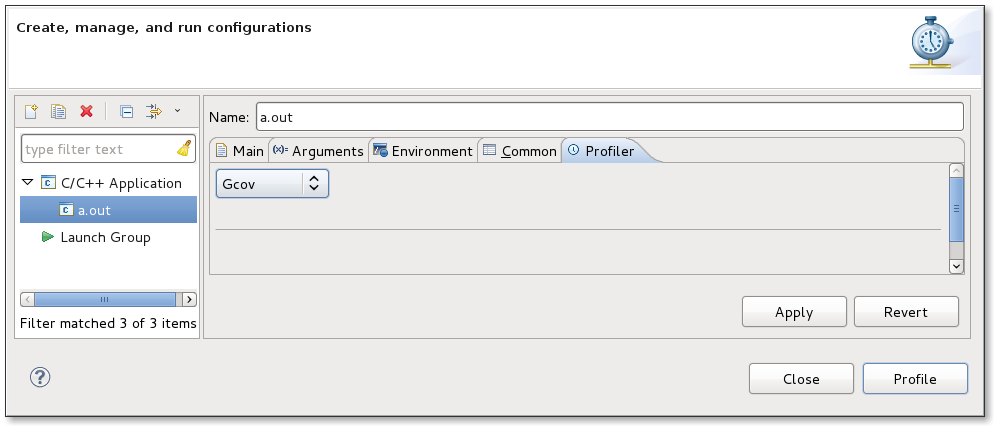
You can also specify the Gcov tool as the profiling tool of choice for Profile as...->Local C/C++ Application using the Profiler tab.
|
|

|
|
| Opening gcov result | Gcov main view |