

| GDB Trace Perspective | ||
|---|---|---|
|
|
|
|
| Getting Started | Collecting Tracepoint Data | |
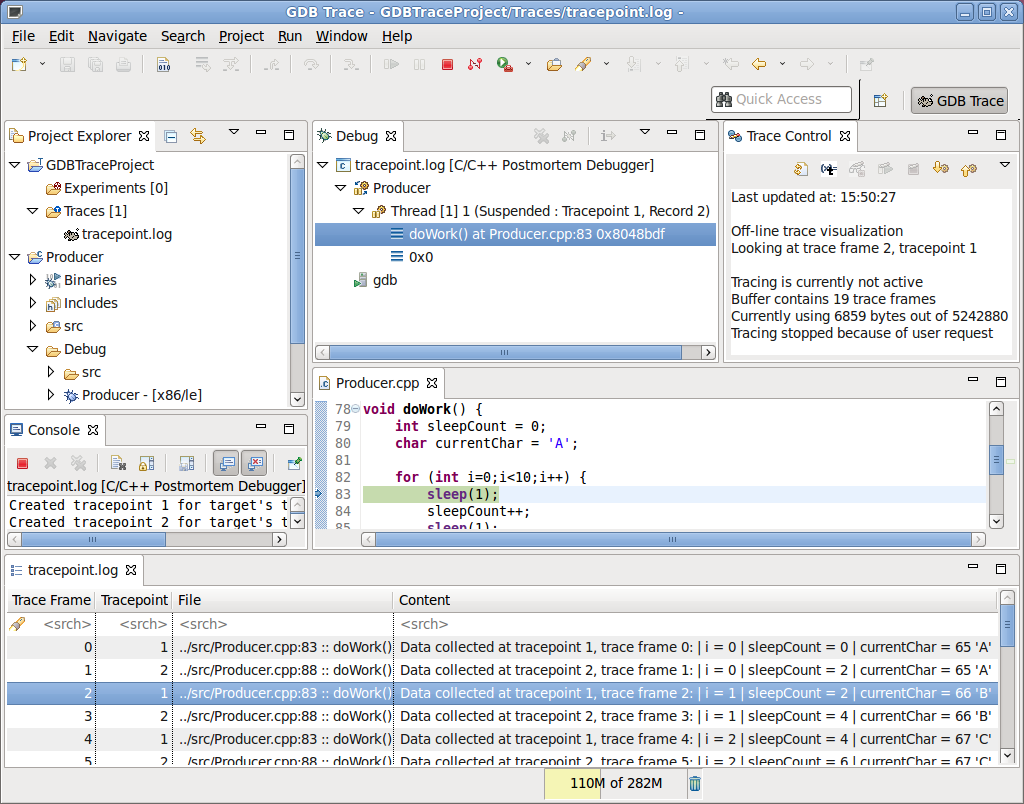
To open the perspective, select Window > Open Perspective > Other... > GDB Trace.
The perspective includes the following views by default:
The editor area contains the Events and C/C++ editors when a GDB Trace is opened.
|
|

|
|
| Getting Started | Collecting Tracepoint Data |