Debug view
The  Debug view shows the target debugging information in a tree hierarchy.
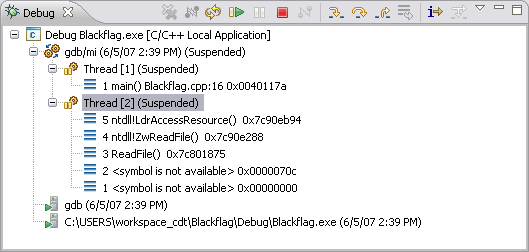
The number beside the thread label is a reference counter, not a thread identification number (TID).
The CDT displays stack frames as child elements. It displays the reason for the suspension beside the thread, (such as end of stepping range, breakpoint hit, and signal received). When a program exits, the exit code is displayed.
The icons that appear in the Debug view include:
| Icons | Session item | Description |
|---|---|---|
|
|
Launch instance | Launch configuration name and launch type |
|
|
Debugger instance | Debugger name and state |
|
|
Thread instance | Thread number and state |
|
|
Stack frame instance | Stack frame number, function, file name, and file line number |
In addition to controlling the individual stepping of your programs, you can also control the debug session. You can perform actions such as terminating the session and stopping the program by using the debug launch controls available from Debug view.
Debug view toolbar options
The table below lists the toolbar options displayed in the Debug view.
| Icons | Action | Description |
|---|---|---|
|
|
Remove All Terminated Launches | Clears all terminated processes in Debug view |
| Connect to a Process | Enables the selection of a running process to debug. | |
|
|
Restart | Starts a new debug session for the selected process |
|
|
Resume | Select the Resume command to resume execution of the currently suspended debug target. |
|
|
Suspend | Select the Suspend command to halt execution of the currently selected thread in a debug target. |
|
|
Terminate | Ends the selected debug session and/or process. The impact of this action depends on the type of the item selected in the Debug view. |
|
|
Disconnect | Detaches the debugger from the selected process (useful for debugging attached processes). |
|
|
Step Into | Select to execute the current line, including any routines, and proceed to the next statement. |
|
|
Step Over | Select to execute the current line, following execution inside a routine. |
|
|
Step Return | Select to continue execution to the end of the current routine, then follow execution to the routine's caller. |
|
|
Drop to Frame | Select the Drop to Frame command to re-enter the selected stack frame in the Debug view. |
|
|
Instruction Stepping Mode | Activate to enable instruction stepping mode to examine a program as it steps into disassembled code. |
|
|
Use Step Filters | Select the Use Step Filters command to change whether step filters should be used in the Debug view. |
| Menu | Use the Debug view menu to:
|
Debug view context menu commands
The Debug view context menu commands include:
| Icons | Name | Description |
|---|---|---|
|
|
Copy Stack | Copies the selected stack of suspended threads as well as the state of the running threads to the clipboard. |
| Find... | Opens the debug view element searching dialog. | |
|
|
Drop To Frame | Select the Drop to Frame command to re-enter the selected stack frame in the Debug view. |
|
|
Step Into | Select to execute the current line, including any routines, and proceed to the next statement. |
|
|
Step Over | Select to execute the current line, following execution inside a routine. |
|
|
Step Return | Select to continue execution to the end of the current routine, then follow execution to the routine's caller. |
|
|
Instruction Stepping Mode | Activate to enable instruction stepping mode to examine a program as it steps into disassembled code. |
|
|
Use Step Filters | Toggles step filters on/off. When on, all step functions apply step filters. |
|
|
Resume Without Signal | Resume program execution after receiving the signal. |
|
|
Resume | Select the Resume command to resume execution of the currently suspended debug target. |
|
|
Suspend | Select the Suspend command to halt execution of the currently selected thread in a debug target. |
|
|
Terminate | Ends the selected debug session and/or process. The impact of this action depends on the type of the item selected in the Debug view. |
|
|
Terminate and Relaunch | Select the Terminate and Relaunch command to terminate the selected debug target and then relaunch it. |
|
|
Disconnect | Detaches the debugger from the selected process (useful for debugging attached processes) |
|
|
Remove All Terminated | Clears all terminated processes in Debug view |
|
|
Terminate and Remove | Terminates the selected debug target and removes it from the view. |
|
|
Terminate/Disconnect All | Terminates or disconnects all active launches in the view. |
| Properties | Opens the Properties for window showing the process properties. |
![]()
Debug overview
Debug information
![]()
Run and Debug dialog box
Debug Breadcrumb
C/C++ Views

