Starting The Debugger
The debugger is started from the command-line using the cdtdebug.sh script or using the cdtdebug executable. Your installation will contain either the script or the executable depending on which package you have downloaded. The script contains the command-line needed to start Eclipse and to pass appropriate parameters at start-up. The following are the command-line options supported:
-a [pid]
This option specifies that you want to attach and debug an existing executable that is running on your system. If no pid is specified or an invalid pid is specified, the option will bring up a dialog which contains a list of current executables running and you may choose the executable(s) you wish to attach to. The dialog will also give you the option of starting a new executable, if desired, but you cannot specify a build log using this method. When used at the same as the -r option, the pid argument is ignored.
-b <build log>
This option specifies an optional build log to use for indexing the source. The build log is simply the output of a makefile build where the options used to compile the various source files are displayed. The indexer uses these options to figure out what flags and include paths were used and thus can properly parse the code to match the executable. The parsed tree is used to navigate within the code to search for C/C++ elements or to calculate a call hierarchy. If this log is not provided, the Stand-alone Debugger has only the compiler built-ins and default include paths to use which means it may not search properly.
-c <core file>
This option specifies a path to a core file to debug for an executable. The core file should have been created by the specified executable. The executable is specified using the -e option, which is later described. If the core file is invalid or no valid executable is also specified, a dialog will be brought up to allow you to enter the required information.
-e <executable> [args*]
This option specifies a path to an executable to be debugged. If the -c option is previously specified, the executable will be used in conjunction with the core file specified by the -c option. If the -c option is not used, then any additional arguments on the command line will be passed to the main method of the C/C++ application when it is debugged. If you do not specify any of the -a, -c, or -e options (e.g. starting up the Stand-alone Debugger with no arguments), the last valid executable used invoking the debugger (if this isn't the first invocation) will be offered to you via a dialog, which includes the original program arguments and build log. You then have the choice of simply hitting the OK button to debug the last executable again or to change the arguments as desired. If the executable location you specify is invalid or no executable is specified and no previous executable exists, a dialog will be brought up to allow you to enter the required information. The dialog will be appropriate to whether you have selected to debug a core file (-c specified) or not.
-r <addr:port>
This option specified a hostname or IP address and and IP port to connect to to perform remote debugging. The gdbserver must be running on the target and waiting for a connection on the specified port. This option can be used at the same time as the -a option. In such a case a Remote-Attach session will be started allowing the user to attach to different processes on the remote target. The user will need to press the 'connect' button or use the context-menu of the Debug view to choose one or more processes to attach to. In this case the -e flag is optional, and when not specified, a dialog will be used instead to prompt for the binary's location. This option, when used without -a, will trigger a manual Remote debugging session towards a single, pre-selected binary and therefore requires the use of the -e option to specify the location of the binary on the local machine that matches the one on the remote target.
Automated Set-up
As mentioned, the Stand-alone Debugger will initialize Eclipse objects on your behalf on start-up so you can immediately start debugging. For starters, the executable you specify is imported on your behalf into an Eclipse C/C++ project within the Workspace. An Eclipse project is a virtual container object that contains folders, files, etc. and has a particular nature. Folders and files may be virtual and may actually link to objects outside of the workspace. In this particular case, the debug info of the executable specified is used to determine the location of the source files. Each source file is imported in the project, virtually, via a link. This is done so that the C/C++ indexer, which usually works on a project being developed within Eclipse, has access to all code when it is parsing. Usually, the name of the default C/C++ project will be Executables, the default project for importing executables into the CDT via the Executables view.
The nature of a project determines what menus, actions, and views are valid for that project. Menus, actions, and views that are not valid are not made visible. This helps to remove the clutter of all contributed plug-ins to what is pertinent to the task at hand (e.g. if the C/C++ and Java IDE plug-ins are both present, one does not want to see Java tasks when working on a C/C++ project). Many of the plug-ins being used in the Stand-alone debugger only work on C/C++ projects anyway.
Another Eclipse concept is the Perspective. An Eclipse perspective defines the set of views and how they are placed in the main Eclipse Window. A perspective will have a default layout associated with it which can be modified and saved by the end-user for future reference (e.g. adding or removing views). For the purposes of debugging, the Debug Perspective is the appropriate perspective to use and therefore the Stand-alone Debugger opens the Debug Perspective automatically for you. The perspective has all the various views needed to debug your program.
To debug an executable, one needs to launch it via the debugger and to provide options both for the executable and the debugger (in this case, GDB). All the information required to launch and debug is stored in an Eclipse object known as a Launch Configuration. Various plug-ins can contribute different forms of Launch Configuration which can in turn provide UI elements for settings. In the case of the Stand-alone Debugger, debugging an executable results in the automatic creation of a C/C++ Local Application Launch configuration. This type of launch is meant for launching an executable that is local to the current host. Additional parameters are available via the Launch Configuration View such as gdb settings (e.g. gdb path, reverse debugging) and environment variables.
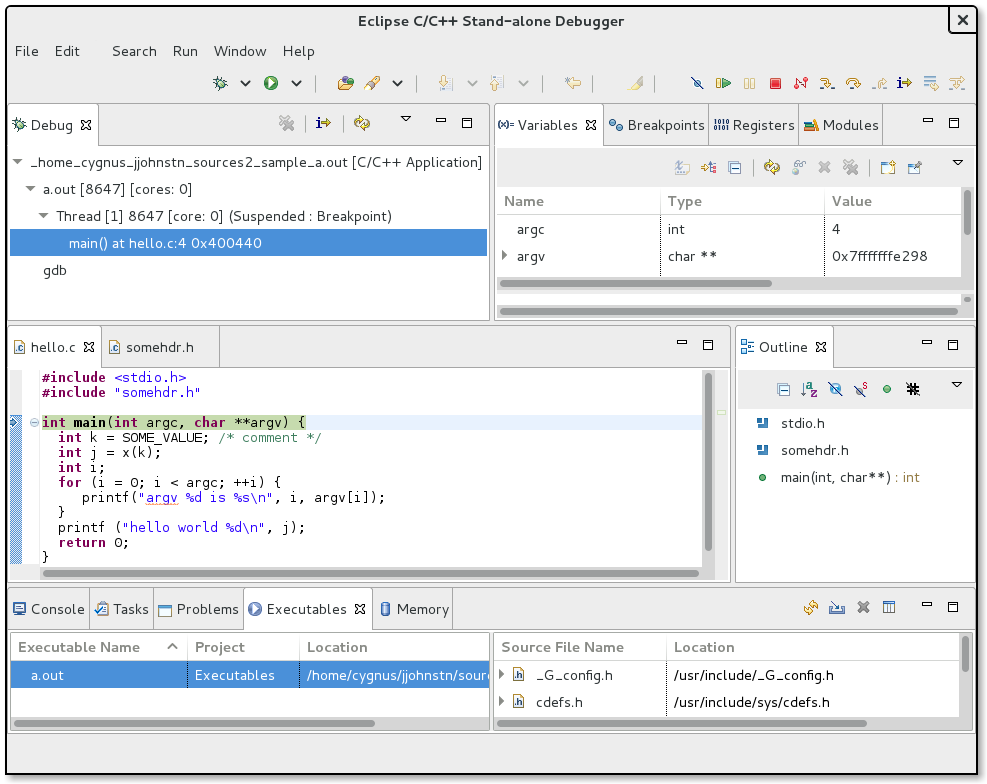
Initial Debugger Layout

CDT Overview
C/C++ Projects
C/C++ Perspectives
C/C++ Indexer
C/C++ Search
