There are two ways to debug applications in Model RealTime. One is to use the Model Debugger. It works as a monitor of a running application generated by Model RealTime that is started in an “observability” mode (enabled by default). In this mode the application interacts with Model RealTime by sending various events with execution data and status (for example, current state of capsules, incarnated capsule instances in capsule parts, values of attributes, current events in controller event queues etc). The Model Debugger lets you interface with the application at a higher abstraction level than what is possible in a C++ debugger. For example, it allows you to send events to ports.
Another way is to debug the generated C++ code with regular source level debugging. Model RealTime is based on Eclipse CDT and it is possible to start a C++ debug session based on the gdb debugger. If you are working with another IDE, you can use its built-in debug possibilities with code generated by Model RealTime.
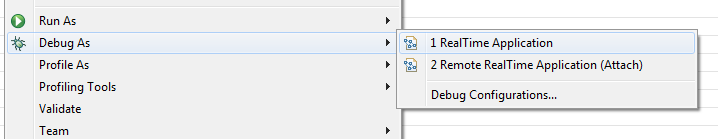
To start a Model debug session of a local running application you should use the context menu command on a TC file: Debug As - RealTime Application.
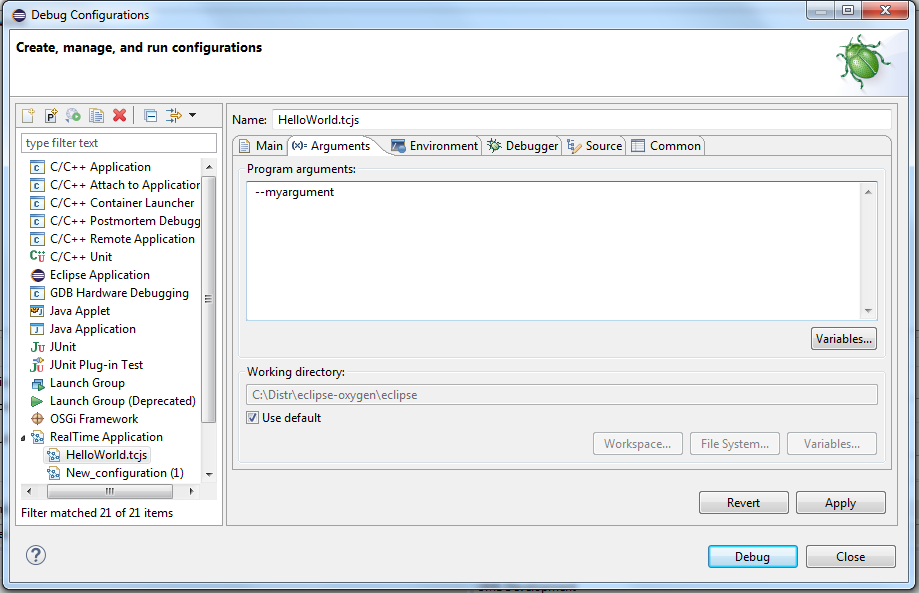
This command will check if the generated code is up to date and launch a debug session for the selected TC. You will be prompted with a dialog to switch to the Model Debug perspective and see output of a locally running application in the Console view. In case you want to specify additional arguments for launching, you should use the standard Eclipse Debug Configurations dialog and create a new debug configuration under the RealTime Application group. For example, you can specify custom command line arguments.
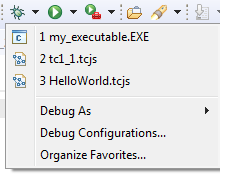
A Debug toolbar button with a history of previously launched debug sessions is available in the main Eclipse toolbar. It’s convenient if you want to repeat launching a previous debug session.
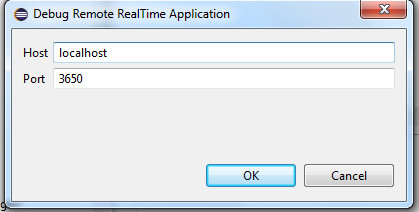
To attach the Model Debugger to an already running application, you should first make sure that the application was launched with the -obslisten=<port_number> command line argument. After that you can use the context menu command on a TC file: Debug As - Remote RealTime Application (Attach). Type the host and the port information in the dialog and press OK to start the debug session. You can later change the remote debug session parameters in the Debug Configuration dialog under the Remote RealTime Application group.
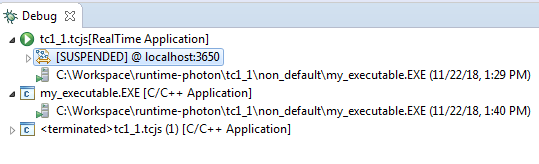
In parallel, or separately with a Model debug session, you can start a C++ debug session using CDT commands available in the context menu of the CDT project: Debug As – Local C/C++ Application, or Remote C/C++ Application. The same rules that were described above are valid for customization of the debug configuration of the C++ application.
All debug sessions are listed in the Debug view that is visible by default under Model Debug perspective.
If you want to do remote C++ debugging you can benefit from installing the Remote Systems Explorer plugin in Eclipse. Among other things it allows you to create a C/C++ Remote Application debug configuration which can automatically transfer the built executable from your local computer to the remote machine where you want to debug it. It can also start the executable remotely. By creating such a remote debug configuration for launching the application with the -obslisten flag, you can then attach to the remotely running application with the model debugger. Just specify the IP address or host name of the remote machine in the dialog that appears.
You can learn more about the Model Debugger in our ![]() documentation and tutorial
documentation and tutorial  video. Share your feedback with us by mailing to model-realtime@hcl-software.com.