
If you are building your Model RealTime application with the Visual Studio compiler, you also need to use the Visual Studio IDE for debugging it. Fortunately it's very easy to do that. Let's look at the steps needed to use Visual Studio 2017 to debug an executable that has been created with Model RealTime.
The first step is to set-up the transformation configuration in Model RealTime so the built executable will contain debug symbols. Open the TC editor and go to the Target Configuration tab. Set $(DEBUG_TAG) in Compile Arguments and /DEBUG in Link Arguments.
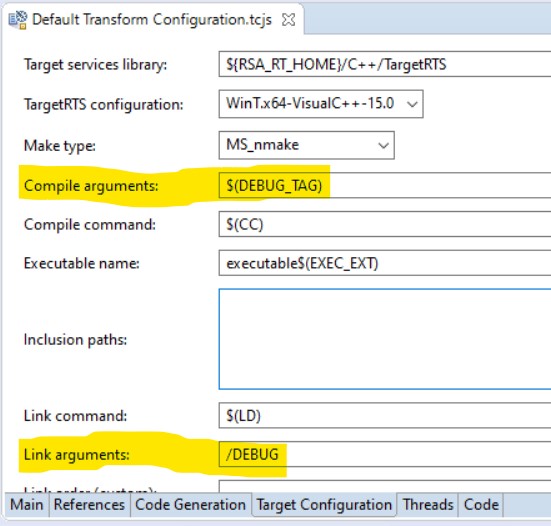
These two settings are sufficient to be able to debug all generated C++ code. However, if you also need to debug into the TargetRTS code, follow these additional steps.
Now you can build your TC as usual to create the executable.
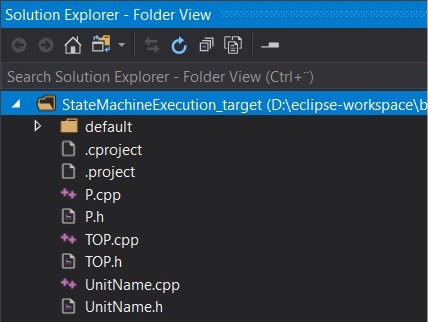
The next step is to open the generated project folder in Visual Studio. Right-click the generated CDT project in Eclipse and do Properties. Copy the full path to the project that is shown as Location in the Properties dialog. In Visual Studio do File - Open - Folder and paste the copied path in the dialog. Then close the dialog to open the content of the folder in Visual Studio.
If you want you can now set some breakpoints in the generated source code. When you are ready to start debugging, right-click the executable in the Solution Explorer and choose Debug.
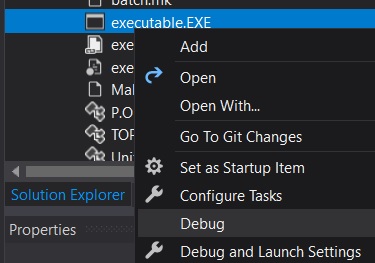
The application is launched and can now be debugged in Visual Studio.
If you need to define command-line arguments, environment variables etc for the debugged application you can use the Debug and Launch Settings command in the context menu of the executable. Choose the Native debugger and edit the launch.vs.json file. For example, to prevent that the debugged application runs under the Model RealTime command-line debugger, set the -URTS_DEBUG=quit command-line argument like this:
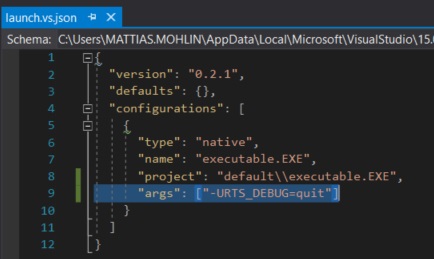
Use Content Assist (Ctrl + Space) in the above file to learn about more configuration properties you can set.
Happy debugging!