You can explore how a transformation configuration (TC) is related to other TCs by graphic visualization of the TC relationships in a diagram. Right-click a TC in the Project Explorer and choose the command Visualize - Explore in Graphs in the context menu. A diagram appears that shows a graphic representation of the TC and the relationships it has with other TCs. By browsing this diagram you can more easily understand what will happen when you build the TC.
Rendering TC visualization diagrams requires GraphViz to be installed. You need to specify the path to the GraphViz dot utility in the preferences (RealTime Development - Visualization).
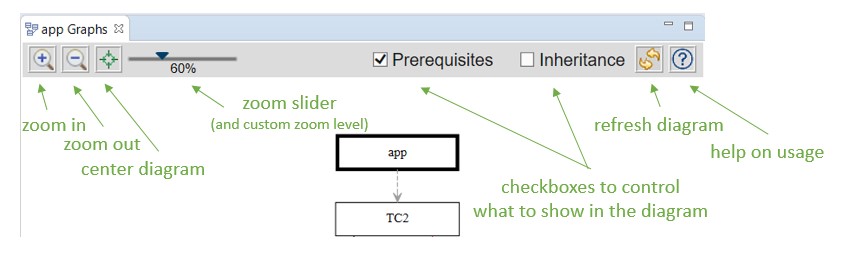
Here is an example of a TC visualization diagram with an explanation of the buttons in the toolbar:
In addition to using the toolbar for zooming, you can also use the mouse scroll wheel. To pan the diagram, click in the background and hold down the button while moving the mouse. You can also use the arrow keys to pan the diagram.
There are two kinds of TC relationships: prerequisites and inheritance. Use the checkboxes in the toolbar to control which of them to show. Unmarking both checkboxes is obviously not so useful since you then only will see the TC itself without any relationships. However, the following 3 combinations render useful diagrams:
Prerequisites shown, Inheritance not shown
In this case the graph shows the actual prerequisites of the TC, i.e. the prerequisites it will have when it is built by the model compiler. Those prerequisites can either be locally defined in the TC, or inherited from another TC. Inherited prerequisites are shown in gray color, others in black color. Here is an example:
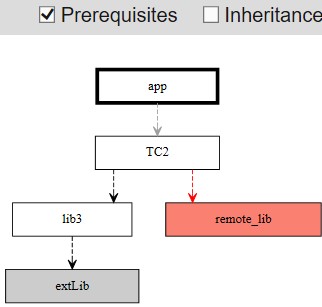
From this diagram we can see that our TC 'app' has one prerequisite to 'TC2'. This prerequisite is not defined in 'app' itself but is inherited from another TC (in this diagram we cannot see from which TC it is inherited). We can also see that 'TC2' has two prerequisites (locally defined) to TCs 'lib3' and 'remote_lib'. The latter of these doesn't currently exist in the workspace which is why it is shown in red color. Finally we can see that 'lib3' has a prerequisite (also locally defined) to 'extLib' which is an external library TC. External library TCs are shown in gray color.
This kind of diagram is often useful because you can more easily understand what will happen when you build the TC (i.e. which TCs that will be built and in which order). You can also use it for troubleshooting build problems, such as circular dependencies between libraries, or required TCs that don't exist in the workspace.
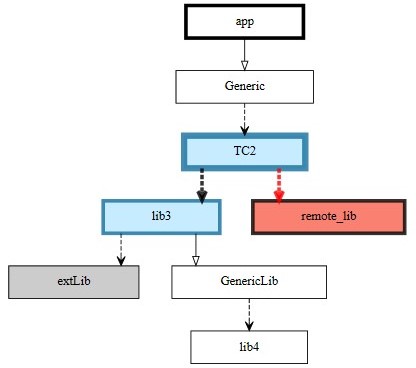
Prerequisites shown, Inheritance shown
In this case the graph will show both prerequisites and inheritance relationships at the same time. For each TC in the graph, its locally defined prerequisites are shown. Note that not all prerequisites shown in this graph will actually be present when the TC is built by the model compiler (due to the rules for how prerequisites are inherited). Since only local prerequisites are shown, they all use black color. Here is an example:
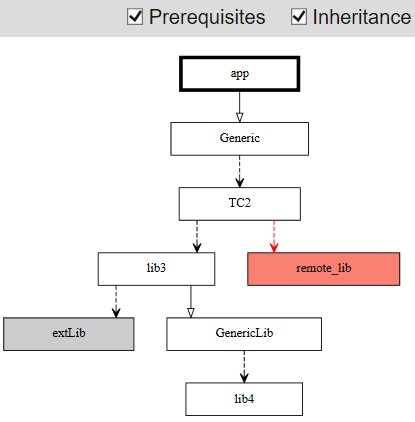
Here we can see that the prerequisite to 'TC2' that was shown as inherited in the previous graph, actually is defined in a TC 'Generic' from which 'app' inherits. We also see that the TC 'lib3' inherits from another TC 'GenericLib' and that this TC has a prerequisite to a TC 'lib4'. However, this prerequisite will not be present when 'app' is built since it is overridden by the prerequisite from 'lib3' to 'extLib'. That is why 'lib4' did not appear at all in the previous graph.
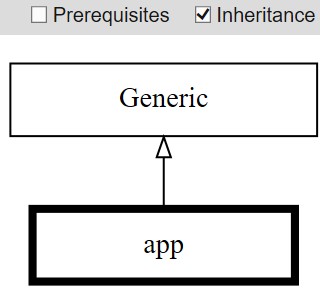
Prerequisites not shown, Inheritance shown
In this case the graph will only show the inheritance hierarchy of the TC. This is useful if you want to understand from which TCs your TC inherits (directly or indirectly). Here is an example:
When you have marked or unmarked a checkbox you need to press the Refresh button to update the diagram. It will not be updated automatically.
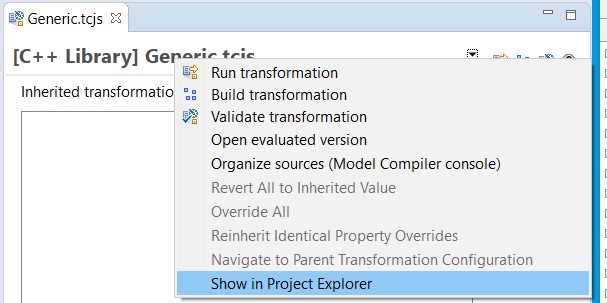
It's often useful to navigate to the TCs shown in the diagram. To do this double-click on the name of a TC. This will open the TC editor for that TC. From there you can use its view menu to show the TC in the Project Explorer.
For big and complex TC graphs it can sometimes be difficult to see how the TCs are related, because the lines may be hard to follow, especially when the diagram is zoomed out. In this case it can help to click on a TC. It will then be highlighted, together with all TCs to which it has a direct relationship.
Here is an example where we have clicked on the TC 'TC2':