Build variant scripts are written in JavaScript and are interpreted by a Java library called Nashorn. There are two kinds of build variant scripts:
Both these kinds of scripts may become sufficiently complicated to require a way to debug them. In simple cases it may be enough to "debug" by tracing messages to the console, for example using the BVF.formatInfo() function. Such messages will be printed to the Build Variants console if the script runs in the context of the Eclipse IDE, and as a model compiler message if the script runs in the context of the model compiler. However, it can be more efficient to debug the script using a proper JavaScript debugger.
To do so, you first need to install a Java IDE with support for debugging JavaScript run by Nashorn. Unfortunately the Eclipse JDT doesn't support this, and you instead need to install NetBeans.
Then to enable debugging you need to add an extra argument to the JVM:
-agentlib:jdwp=transport=dt_socket,address=8000,server=y,suspend=n
This tells the JVM to enable remote debugging through the TCP port 8000. If that port is not available on your machine, you should replace it with a different number.
Where to add the extra JVM argument depends on the kind of build variant script:
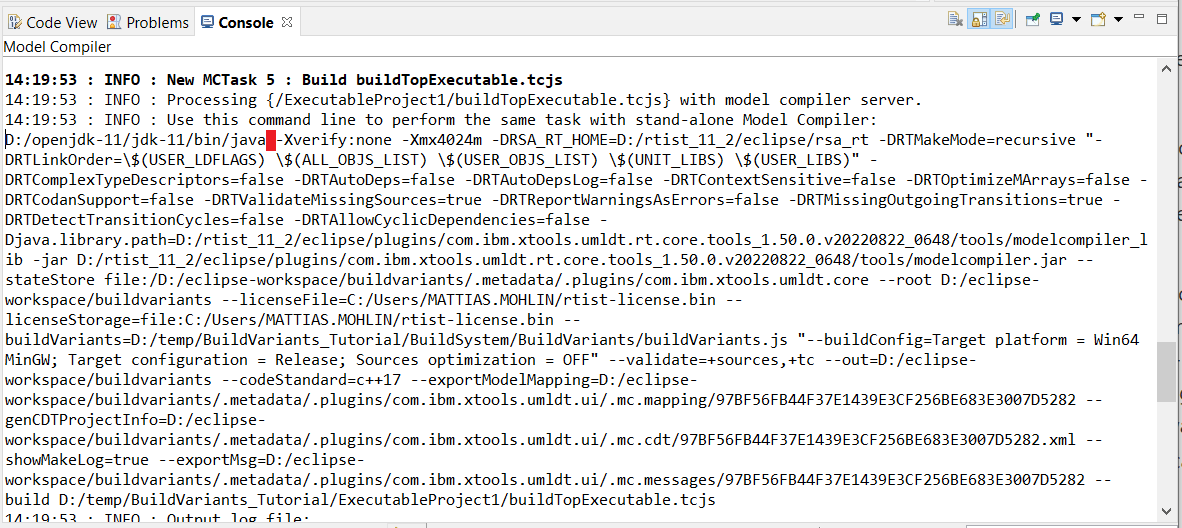
eclipse.ini. You then need to restart Model RealTime.java. In this case it's recommended to replace the last part of the argument so it says suspend=y instead. This will cause the model compiler to wait until you have attached the Netbeans debugger. The easiest way to quickly get the command for invoking the model compiler from the command-line, is to first build the TC from the UI, and then copy the command printed in the "Model Compiler" console. In the picture below the red square marks the position where you need to insert the extra JVM argument to enable debugging.
To attach the debugger invoke Debug - Attach Debugger from the main menu of Netbeans. In the dialog that appears, make sure to specify the same port that you used in the JVM argument. For example:
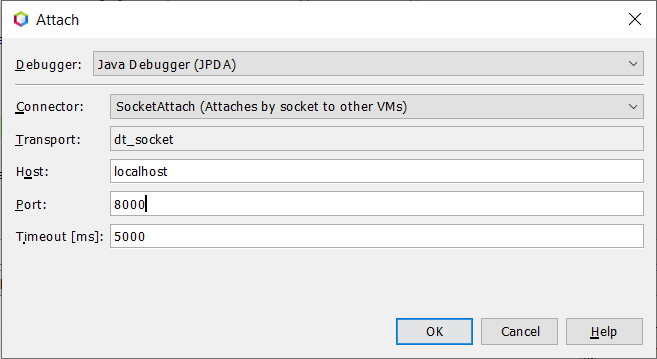
If you run Netbeans from another machine, you need to replace localhost with the host name or IP address where the build variant script runs.
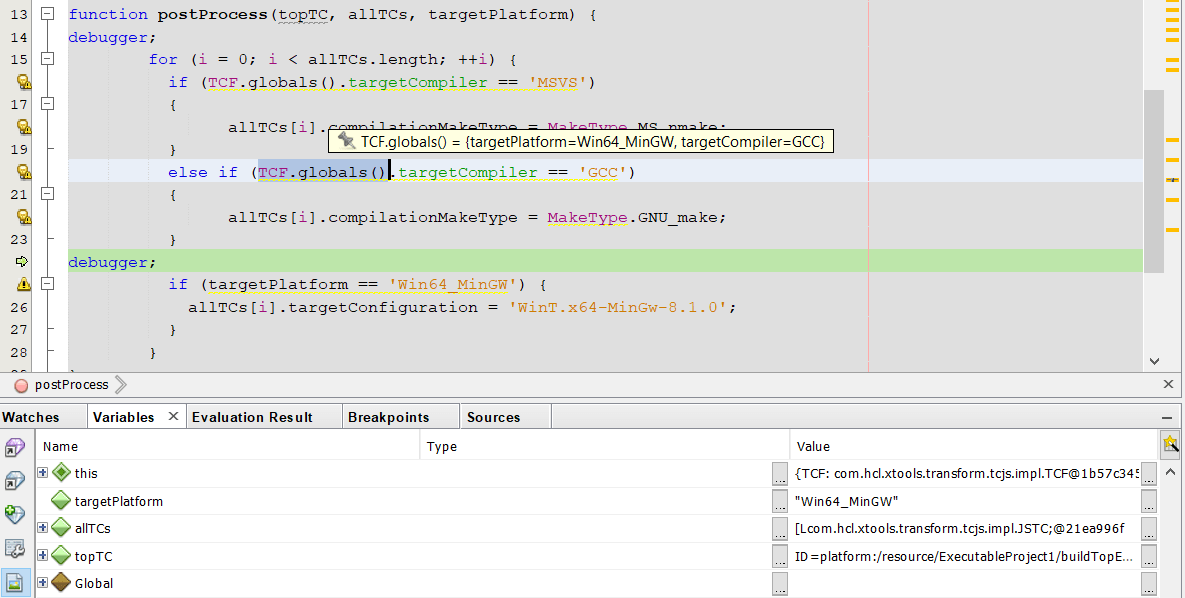
Before you press OK in the above dialog, you should set one or many breakpoints in the build variant script you want to debug. To set a breakpoint, insert the statement debugger; into the script. Whenever that statement executes, and the Netbeans debugger is attached, the script execution will be suspended at that location. You can insert as many debugger; statements as you like, but note that it has to be done before attaching the debugger. Also note that breakpoints can only be set in this way; it is not possible to set them using the Netbeans user interface.
When a breakpoint has been hit you can use the features of the Netbeans debugger to inspect the values of variables, evaluate JavaScript expressions etc. The quickest way to do this is to simply select a variable or expression and use the tooltip for evaluating it, but you can of course also use the Watches or Variables views.